


Electricity
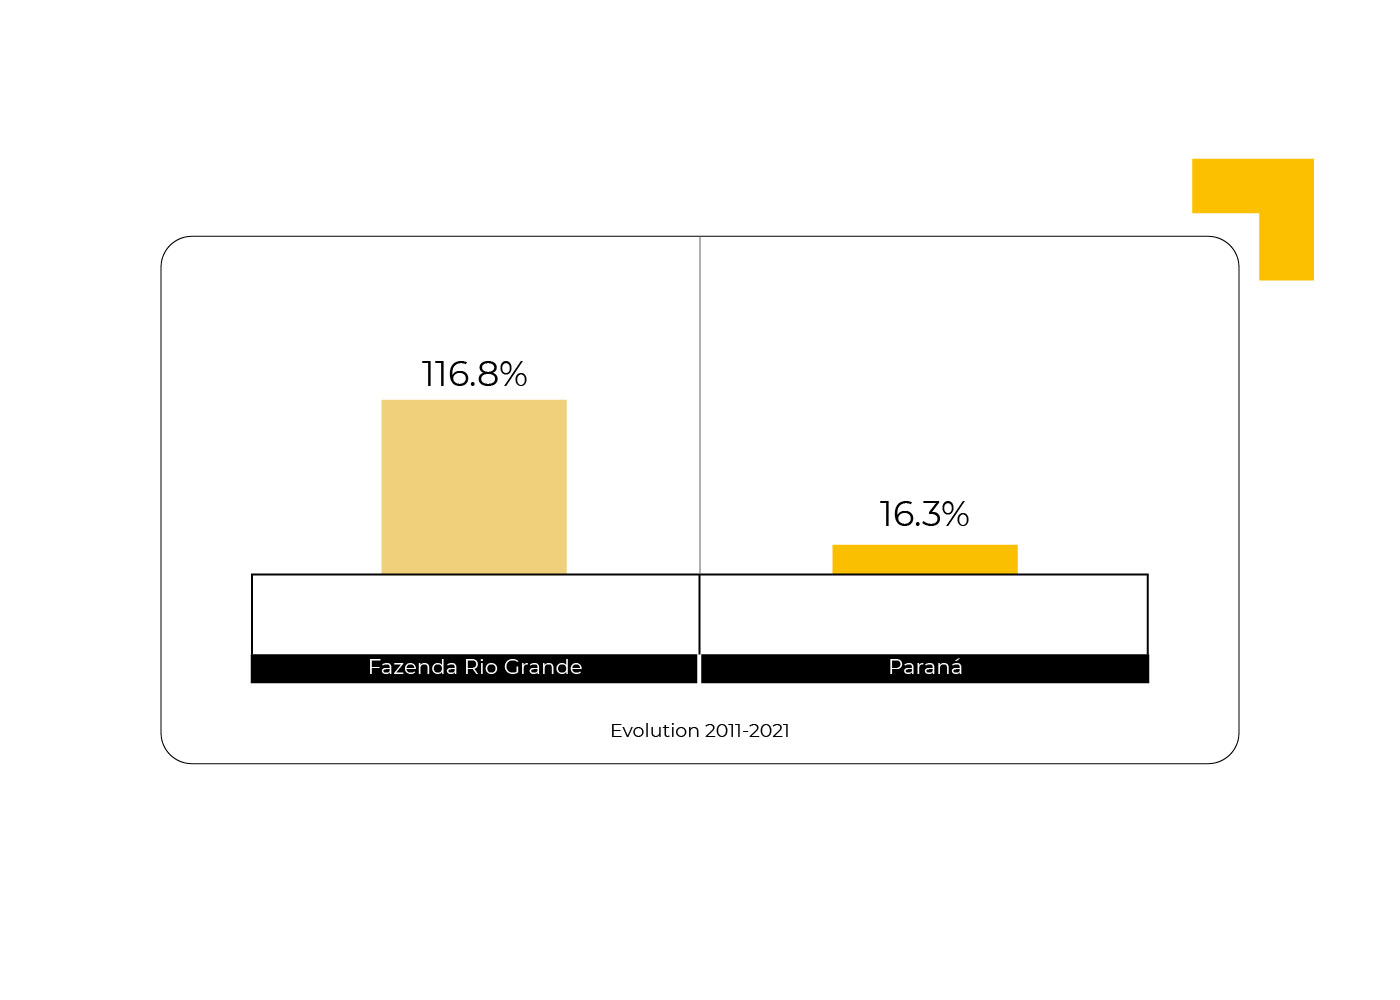
Electric Energy Consumption in the Municipality increased by 116.8% between 2012 and 2021. The number of consumers also increased from 32.1 thousand to 56.7 thousand in 2021.
Table – Electric Energy Consumers
| Fazenda Rio Grande | Paraná | Evolution 2012 – 2021 | |||||||
|
…2012 |
…2021 | …2012 | …2021 | Fazenda Rio Grande | Paraná | ||||
| Consumers | 32,127 | 56,773 | 4,160,456 | 5,025,912 | 76.7% |
20.8% |
|||
|
Residential |
29,624 | 52,555 | 3,300,817 | 4,121,645 | 77.4% | 24.9% | |||
| Secondary Sector (Industry) | 384 | 469 | 88,758 | 71,380 | 22.1% |
-19.6% |
|||
|
Commercial Sector |
1,434 | 3,103 | 336,101 | 429,262 | 116.4% | 27.7% | |||
| Rural | 511 | 382 | 379,130 | 347,714 | -25.2% |
-8.3% |
|||
|
Other Classes |
174 | 245 | 55,556 | 53,529 | 40.8% | -3.6% | |||
| Free Consumption (Industry) | 0 | 19 | 0 | 2,382 | 0.0% |
0.0% |
|||
Source: Government of the State of Paraná
Graph – Evolution of Electric Energy Consumers

Source: Government of the State of Paraná
Table – Electric power consumption
|
Fazenda Rio Grande |
Paraná | Evolution 2011-2021 | ||||||
| …2012 | …2021 | …2012 | …2021 | Fazenda Rio Grande |
Paraná |
|||
|
Consumers |
133,809 | 290,061 | 27,008,009 | 31,406,263 | 116.8% | 16.3% | ||
| Residential | 52,598 | 92,280 | 6,748,213 | 8,229,165 | 75.4% |
21.9% |
||
|
Secondary Sector (Industry) |
52,892 | 22,837 | 7,720,459 | 2,319,288 | -56.8% |
-70.0% |
||
|
Commercial Sector |
16,615 | 26,690 | 5,162,861 | 4,215,932 | 60.6% | -18.3% | ||
| Rural | 1,907 | 1,714 | 2,054,625 | 2,488,755 | -10.1% |
21.1% |
||
|
Other Classes |
9,796 | 13,709 | 2,283,182 | 2,406,028 | 39.9% | 5.4% | ||
| Free Consumption (Industry) | – | 132,830 | 3,038,676 | 11,747,084 | 0.0% |
286.6% |
||
Source: Government of the State of Paraná
Graph – Evolution of Electric Energy Consumption
Source: Government of the State of Paraná
