


The GDP: Gross Domestic Product represents the sum of all final goods and services produced in a given municipality, region, state, or country during a period. GDP is one of the most used indicators to evaluate the economic activity of a territory.
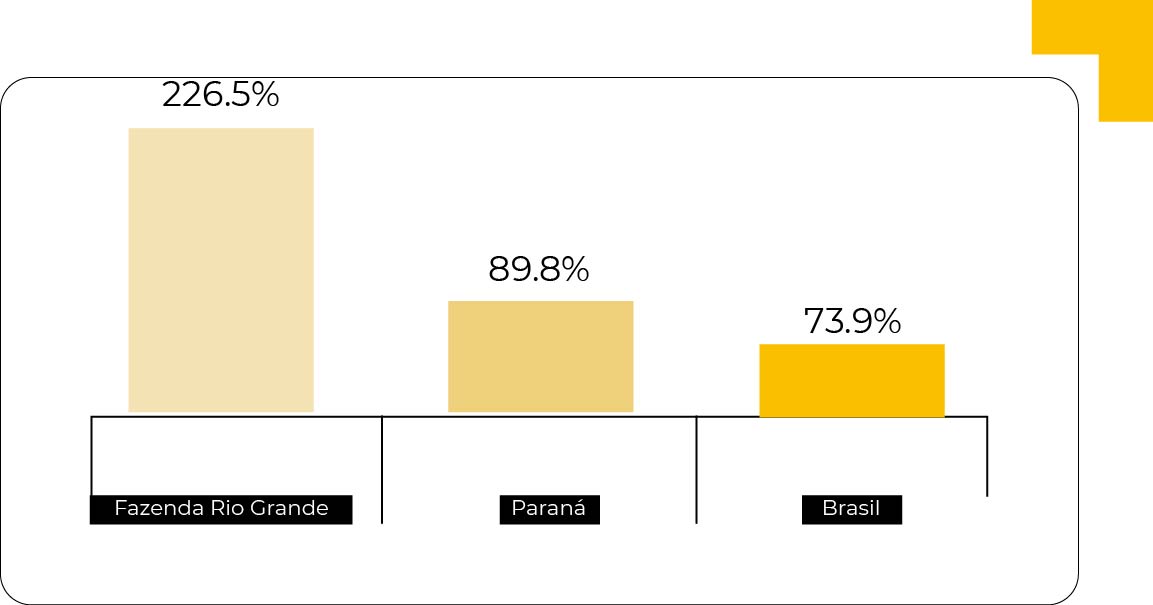
The municipality of Fazenda Rio Grande, in 2020, reached the mark of 2.7 billion reais in its GDP against 848.8 million reais in 2011. Only in this period between 2011 and 2020, the municipal GDP grew 226 5%, an evolution higher than that of the State of Paraná, which in the same period was 89.8% and lower than that of Brasil, 73.9%.
Table – GDP
|
In R$ 1,000,00 |
In US$ 1,000,00 | |||||
| Year | Fazenda Rio Grande | Paraná | Brasil | Fazenda Rio Grande | Paraná |
Brasil |
| …2011 | 848,805 | 257,122,269 | 4,376,382,000 | 168,080 | 50,915,301 | 866,610,297 |
| …2012 | 968,330 | 285,620,202 | 4,814,760,000 | 191,749 | 56,558,456 | 953,417,822 |
| …2013 | 1,325,511 | 333,481,152 | 5,331,618,957 | 262,477 | 66,035,872 | 1,055,766,130 |
| …2014 | 1,586,646 | 348,084,191 | 5,778,952,780 | 314,187 | 68,927,563 | 1,144,347,085 |
| …2015 | 1,758,886 | 376,962,822 | 5,995,787,000 | 348,294 | 74,646,103 | 1,187,284,554 |
| …2016 | 2,066,526 | 401,814,164 | 6,269,328,000 | 409,213 | 79,567,161 | 1,241,451,089 |
| …2017 | 2,382,277 | 421,497,870 | 6,585,479,000 | 471,738 | 83,464,925 | 1,304,055,248 |
| …2018 | 2,518,919 | 440,029,403 | 7,004,141,000 | 498,796 | 87,134,535 | 1,386,958,614 |
| …2019 | 2,503,498 | 466,377,036 | 7,389,131,000 | 495,742 | 92,351,888 | 1,463,194,257 |
| …2020 | 2,771,416 | 487,930,594 | 7,609,597,000 | 548,795 | 96,619,920 | 1,506,850,891 |
Source: Brazilian Institute of Geography and Statistics – IBGE
Note: Quotation 1 dollar = BRL 4.84 in July 2023
Graph – Evolution of GDP in % – 2011 – 2020
Source: Brazilian Institute of Geography and Statistics – IBGE
